
VISIONS data in the ESO archive

As an ESO public survey, VISIONS releases its data products to the worldwide community. Two data releases are public, and further releases will follow.

Data releases

Each release is fully calibrated and comes with release documentation in the ESO archive.

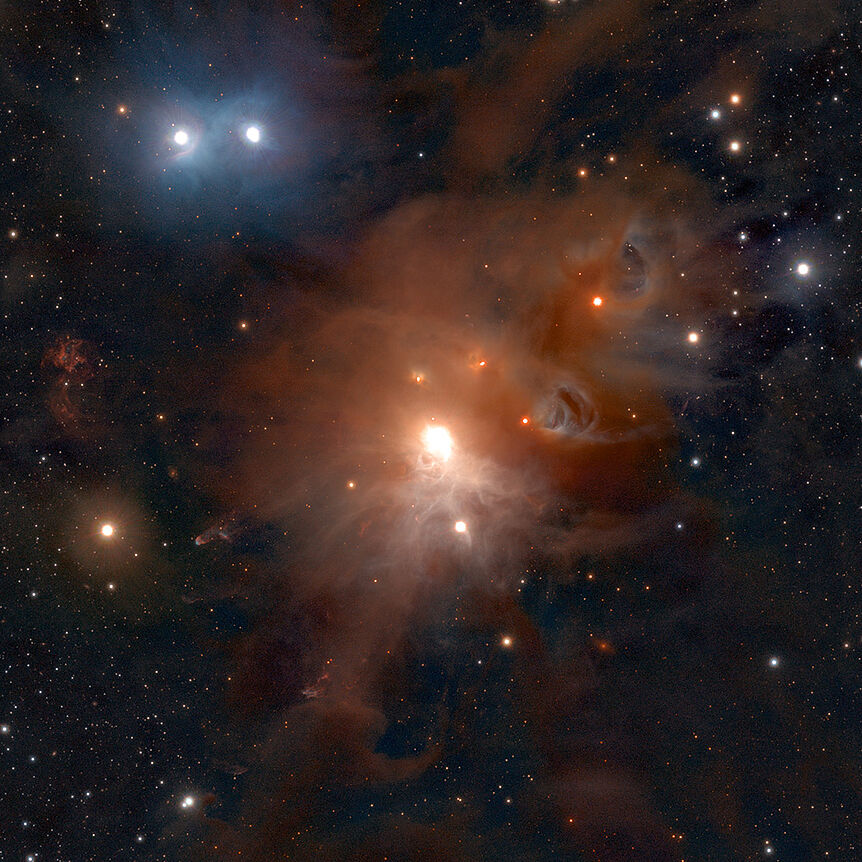
Near-infrared view of the Corona Australis star-forming region

Data Release 2 · 28 February 2022

Corona Australis

All observations of the Corona Australis star-forming region collected between April 2017 and October 2021: 3360 files constructed from 72 336 individual images, 840 GB in volume, covering about 43 square degrees with contiguous tiles, stacked pawprints, weight maps, and source tables. Astrometry is calibrated against Gaia EDR3 with a typical dispersion of 15 to 20 mas; photometry is tied to 2MASS with uncertainties at the percent level or better for bright sources. The sensitivity reaches 21.8, 21.1, and 19.9 mag in J, H, and Ks, and most data feature point-source FWHMs better than 1 arcsec.
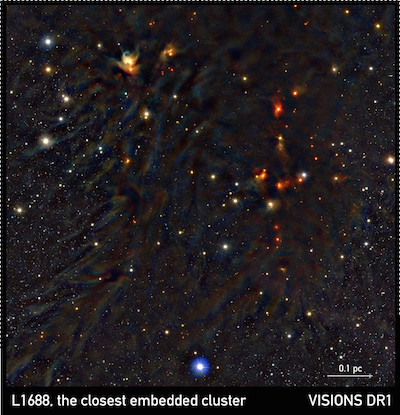
Near-infrared view of L1688, the closest embedded cluster, from VISIONS Data Release 1

Data Release 1 · 10 March 2019

Ophiuchus

The first release in the series, finished together with ESO, contains deep near-infrared photometry of the Ophiuchus star-forming region along with a control field. Data access and the release documentation are available through the ESO archive.

Data products

The survey provides the following data products to the community:

  • Processed pawprints with the instrumental signature removed, including photometric and astrometric calibration compliant with the WCS standard, with Phase 3 compatible FITS headers
  • Stacked tiles constructed from the processed pawprints, also Phase 3 compliant with appropriate headers
  • Weight (confidence) maps for both the processed pawprints and the stacked tiles
  • A quality control database, including maps tracing background noise, seeing, PSF shape, exposure time, frame coverage, effective observing time, and completeness estimates
  • Derived source catalogs for both pawprints and stacked tiles, including positions, multi-aperture photometry, and morphological classification
  • Homogeneous band-merged catalogs, constructed directly from the VISIONS data (deep and control survey) or merged with VHS data (wide survey)
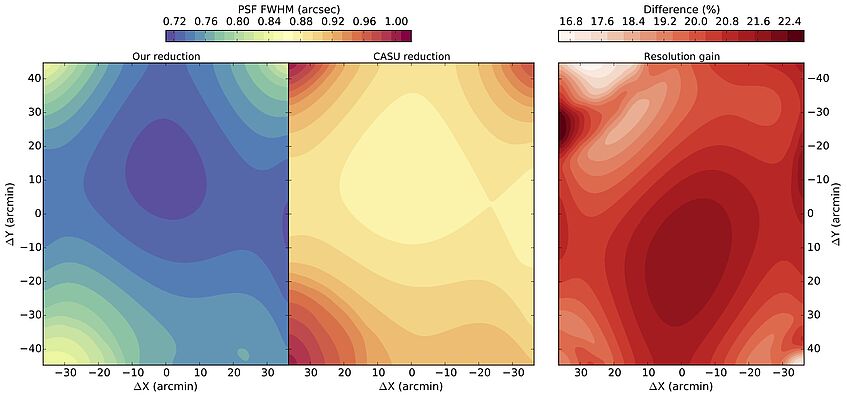
Comparison of FWHM maps from the VISIONS pipeline and the standard CASU pipeline for a tile in the H band
FWHM maps of a tile in the H band, for the pilot study reduction and the standard CASU pipeline. The VISIONS pipeline achieves a resolution gain of about 20% (Meingast et al. 2016).
Software

The vircampype pipeline

All VISIONS data are processed with vircampype, a pipeline environment purpose-built for the survey and operated at the University of Vienna. The pipeline is written in Python and makes heavy use of C extension libraries for vectorized computations; its source code is freely available.

A detailed description of the implemented algorithms is given in the second paper of the VISIONS series.

VISIONS is a public survey of the European Southern Observatory, led at the University of Vienna.

University of Vienna European Southern Observatory